
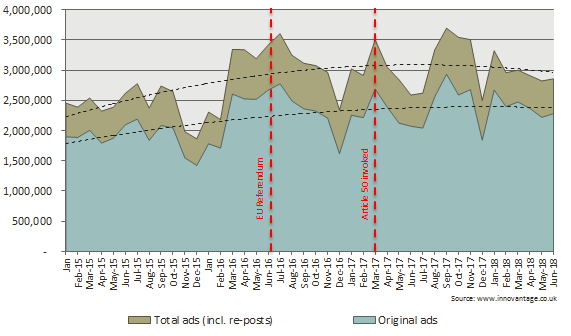
At c.2.28m in June 2018, the number of original job ads captured by Innovantage was 22% higher than in the same month last year but 1% lower than in the month of the EU referendum in June 2016 – when there was notably heightened advertising activity.
- In addition, 0.57m reposts of previous adverts were captured - suggesting that the role was unfilled via the original post and/or it was a role that an employer continually advertises. This equated to 25% of the volume of original ads posted.
- At 2.9m, the combined total of original job ads and reposts was the same as in June 2017 but was 16% lower than in June 2016.
The number of original job ads, and the total (including reposts), Jan 15 – June 18
Set into context of the most recent total number of UK workforce jobs (35.2m in March 2018), the workforce jobs total was just 0.5% (192k) higher than a year earlier and 2.2% (759k) higher than in March 2016.
And set in context of the official ONS vacancy number for the quarter ending June 2018 (824k), UK vacancy numbers were 5% higher than the figure one year earlier and 11% higher than in April-June 2016.
For each official vacancy, employers and their intermediaries posted 2.8 original jobs ads in June 2018 (a ratio of 2.8 to 1):
- This was higher than the ratio of 2.4 to 1 a year earlier but down from 3.6 to 1 in June 2016.
The ratio of total ads (including reposts) to official vacancies was 3.5 to 1 in June 2018:
- This was up from 2.9 to 1 in June 2017 but significantly lower than the ratio of 4.6 to 1 in June 2016.
Engagement status: perm and contingent ads were proportionally down, YoY, as more ads (+7 points to 30%) carried no details of engagement status.
- Just over half of all ads (51% / 1,176k) specified a permanent employment opportunity in June 2018:
- This figure was 11% higher than the figure recorded in June 2017
- Proportionally, however, it was lower the 57% of all original ads highlighting a permanent opportunity a year earlier.
- A further one in five ads (19% / 423k) highlighted a contract or temporary opportunity in June 2018:
- This was 10% higher than the figure recorded in June 2017
- Proportionally, however, it was lower than the 21% of ads specifying a contingent opportunity in June 2017.
- There was a 10% fall in the number of ads highlighting that work was temporary, whilst there was a 24% increase in contract opportunities.
- 30% of all original ads in June 2018 did not carry any detail of engagement status:
- This was up from 23% in June 2017
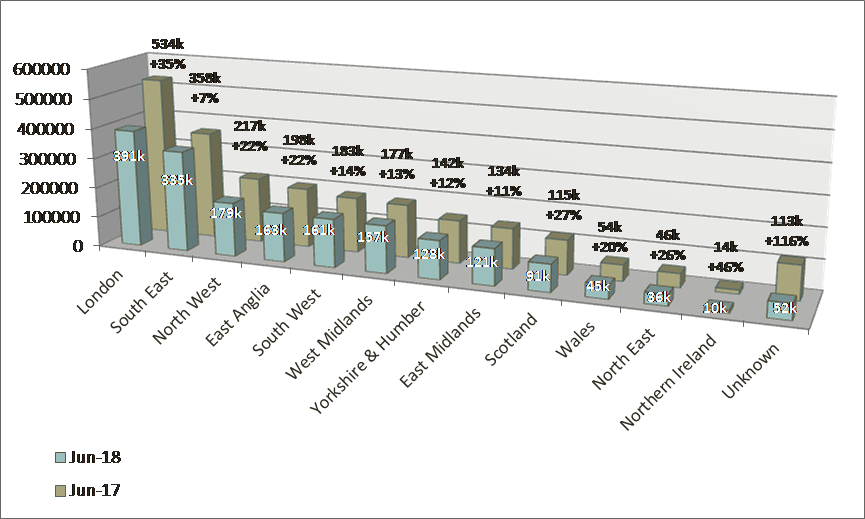
Regional profile: London, Scotland and Northern Ireland face heightened challenges in recruiting
Beneath the 22% YoY increase in the volume of original online job ads across the UK, the regional variations were noteworthy. Amongst regions where the YoY increase was higher than the UK average:
- In London, the volume of original ads was 35% higher than in June 2017.
- In the latest available workforce jobs profile (March 2018), the volume of jobs in London was just 2% higher YoY.
- Employers and their intermediaries in Scotland posted 27% more jobs in June 2018 than a year earlier:
- The number of workforce jobs actually decreased by 50k / 2% in Scotland in the year to March 2018.
- Original job ad numbers in Northern Ireland were 46% higher than in the same period last year:
- The number of workforce jobs was just 13k / 1% higher, however, in March 2018 than March 2017.
All original job ads, by region, June 2017 and June 2018
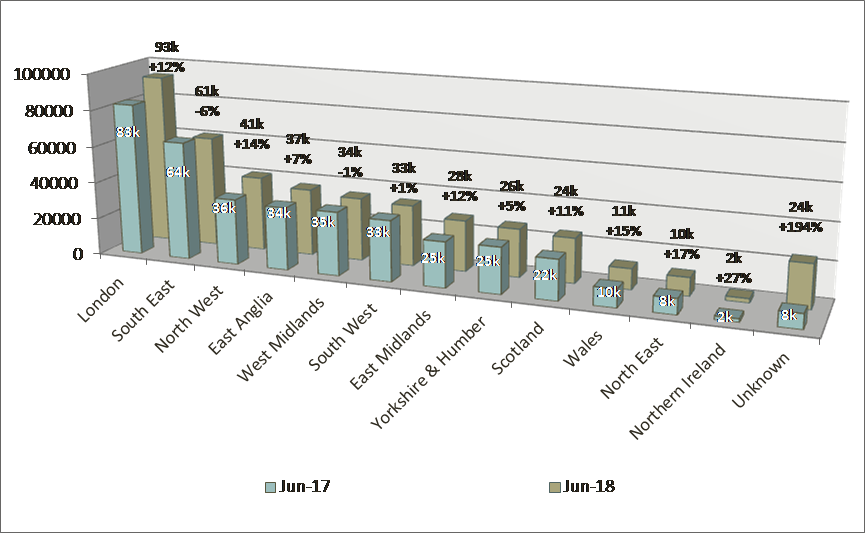
Beyond the 10% overall annual increase in the number of original temporary/contract ads posted in June 2018, the YoY change in the proportion of contingent ads by region should be set into context of an increase in the volume of ads carrying no locational detail.
- The proportion of perm ads where no location was specified (4%) was also higher than the level in June 2017 (2%).
- The proportion of contingent ads where no location was specified (6%) was higher than the level recorded June 2017 (2%).
Above average increases were experienced in a handful of regions (including London, NW, NE, Ireland & Wales) whilst, in contrast, there was small downturn in the West Midlands.
Original job ads specifying temporary or contract work, by region, June 2017 & June 2018
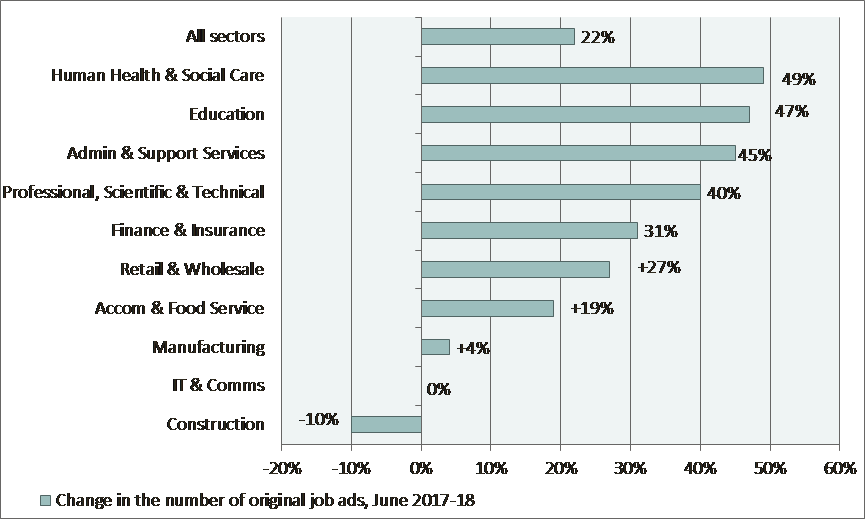
Industry profile: significantly above average increase in demand within critical front-line service occupations
Percentage change in the number of original job ads, by sector, June 2017-18
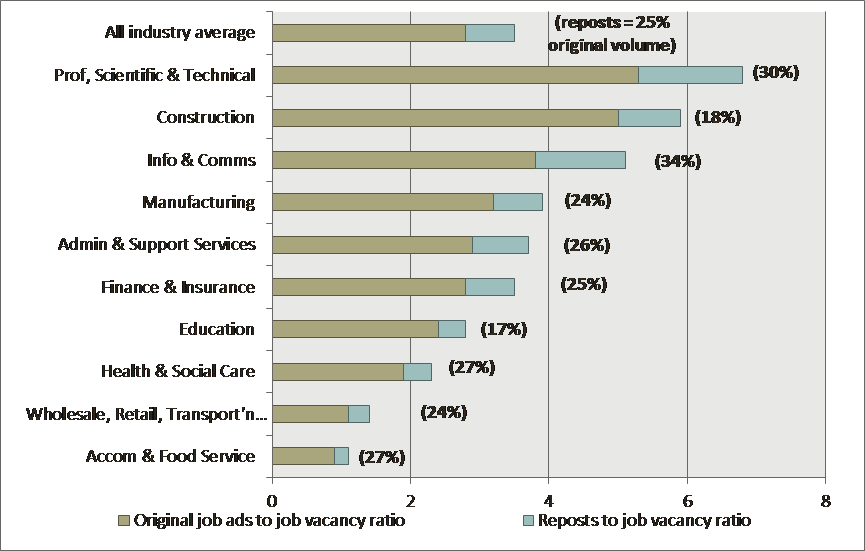
Combined ratio of original job ads & reposts to ONS vacancy numbers (+ reposts as a percentage of original posts), June 2018
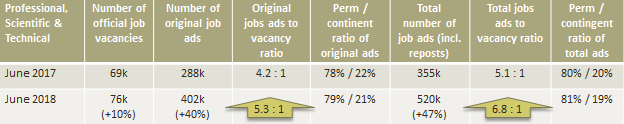
Professional, scientific & technical
Within the Professional, Scientific & Technical industries, a notable 10% year-on-year increase in official vacancies translated into a 40% increase in original job ads. This included a 51% year-on-year increase in legal vacancies. The ratio of original ads to official vacancies rose significantly from 4.2 to 1 in June 2017 to 5.3 to 1 this year. When reposts were added, the ratio of total ads was 6.8 to 1 official vacancy – notably higher than 5.1 in the same month last year – and almost twice the all occupation average (3.5 to 1).
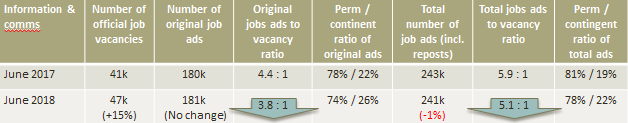
Information & communications
Despite an 8% annual increase in the number of official vacancies, the number of original job ads and total ads remained flat year-on-year. There were notable exceptions in the underlying occupations, however. This included a 5% decrease in original ads for software engineers. In contrast original ads for Technical Architects rose by 32% whilst ad numbers for IT Security roles increased by 14%.
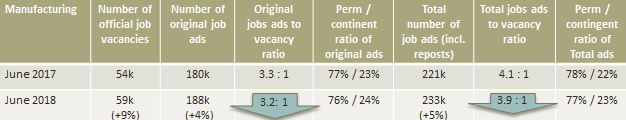
Manufacturing
The number of original ads and total ads for manufacturing roles rose in line with a 9% year-on-year increase in official vacancy numbers – albeit by slightly lower percentages (4% and 5%, respectively). Demand within automotive manufacturing was a notable outlier, with a 24% year-on-year increase in original ads whilst, in contrast, the all-sector volume of ads for design engineers was 10% lower than in June 2017.
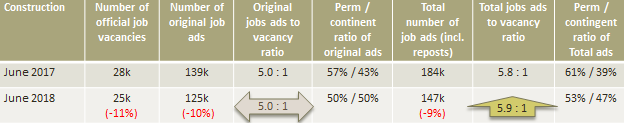
Construction
Within the Construction sector, an 11% fall in official vacancy numbers was mirrored by a 10% fall in original ads and a 9% fall in total ads. Amongst the underlying occupations, there was a noteworthy year-on-year deterioration in the volume of original ads for construction workers (-16%), for surveyors (-19%) and for roles in civil engineering (-15%). At 5.0 to 1, despite the decline in demand, the ratio of original ads to official vacancies remains significantly higher than the al occupation average (2.8 to 1), however, highlighting the ongoing resourcing challenges being faced by employers in the sector.
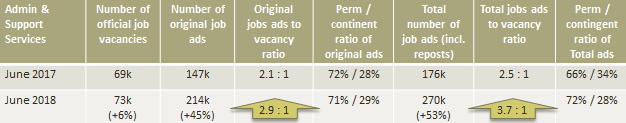
Admin & Support Services
Whilst the number of official vacancies increased by 6%, year-on-year amongst employers working within the Admin and Support Services sector, there was a notable surge in on-line job advertising (+45%, YoY, in original ads). Amongst the underlying occupations, original ads for PAs increased by 55% YoY and there was a 40% annual increase in ads for Call Centre operatives and Customer Services Advisors. This included an 84% rise in the number of ads for travel advisors.
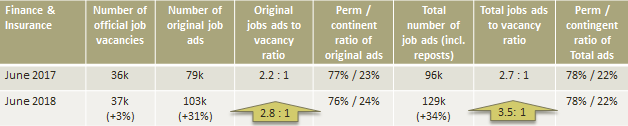
Finance & Insurance
Whilst the official vacancy number was up by just 3% in in the year to April-June 2018, the number of original ads rose by more than a third (34%) in the year to June. This increase included notable rises in the number of original ads for Actuaries (+90%), Investment Management (+38%) and Underwriting professionals (+57%).
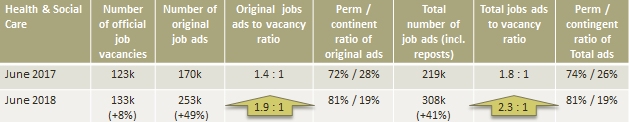
Health & Social Care
An 8% year-on-year rise in the official number of Health & Social Work job vacancies is noteworthy in and of itself. To service the increased demand, however, it required employers and their intermediaries to increase the number of original job ads by 49%. This included a 90% rise in the number of ads for nurses, a 77% rise in the number of ads for Doctors and 66% more ads for consultants than in June 2017. There also appears to be a shift towards offering more permanent work opportunities, with the proportion of ads offering this status (where the status was articulated) increasing from 72% to 81%, year-on-year.
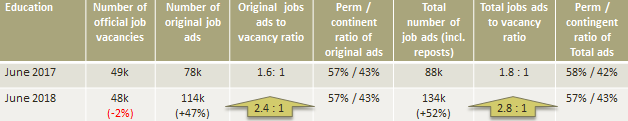
Education
Whilst there was a year-on-year 2% fall in official vacancies within the education sector, the number of original job ads through which employers and their intermediaries were seeking to fill the diminished surged by 47%. As with Health & Social Care, this suggests a significant tightening in the availability of workers within the Education sector. Notable year-on-year rises in advertising activity were witnessed for roles as supply teachers (+85%), Headteachers (+56%) and Teaching Assistants (+94%). A 41% annual increase in ads for Lecturers suggests the FE & HE sectors are also experiencing challenges.
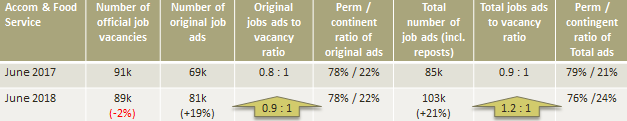
Accommodation and Food Service
Whilst the official number of vacancies within the Accommodation & Food Service sector was 2% lower than the same period last year, original job ads were 19% higher. Amongst the underlying occupations, there were 21% more original ads for waiting staff and bartenders and 51% more for Baristas.
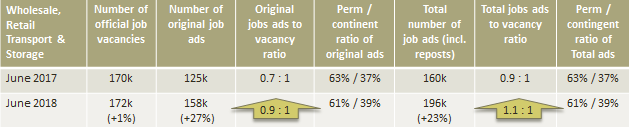
Wholesale, Retail, Transport & Storage
Whilst the number of official vacancies was just 1% higher in April-June 2018 than a year earlier, employers and their intermediaries posted 27% more original ads in June 2018 than in the same month last year. It is amongst store assistants that the greatest challenge appears to be being faced, with original ad numbers up 43%, year-on-year.