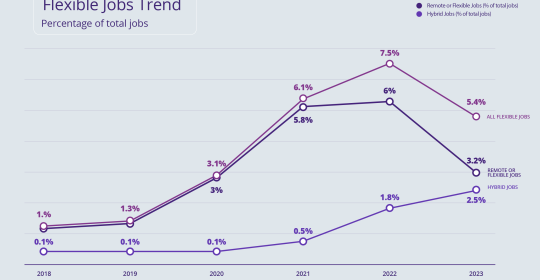

Data from the Wave Quarter 2 Recruitment Trends Report has shown that jobs and applications are down on quarter 1 but were largely impacted by the bank and school holidays in April and May, with activity significantly increasing in June.
Q2 figures take a dive
Job activity in the second quarter of 2023 decreased from the first, with jobs in Q2 5% under Q1’s figures and applications 13% under. The average application per job in Q2 was 18, compared to 21 in Q1 (although, to gain some perspective, 18 is higher than the figure for any quarter in 2022). The above average number of bank and school holidays falling in Q2, especially this year with the extra holiday for the King’s coronation, clearly impacted activity in the quarter as a whole.
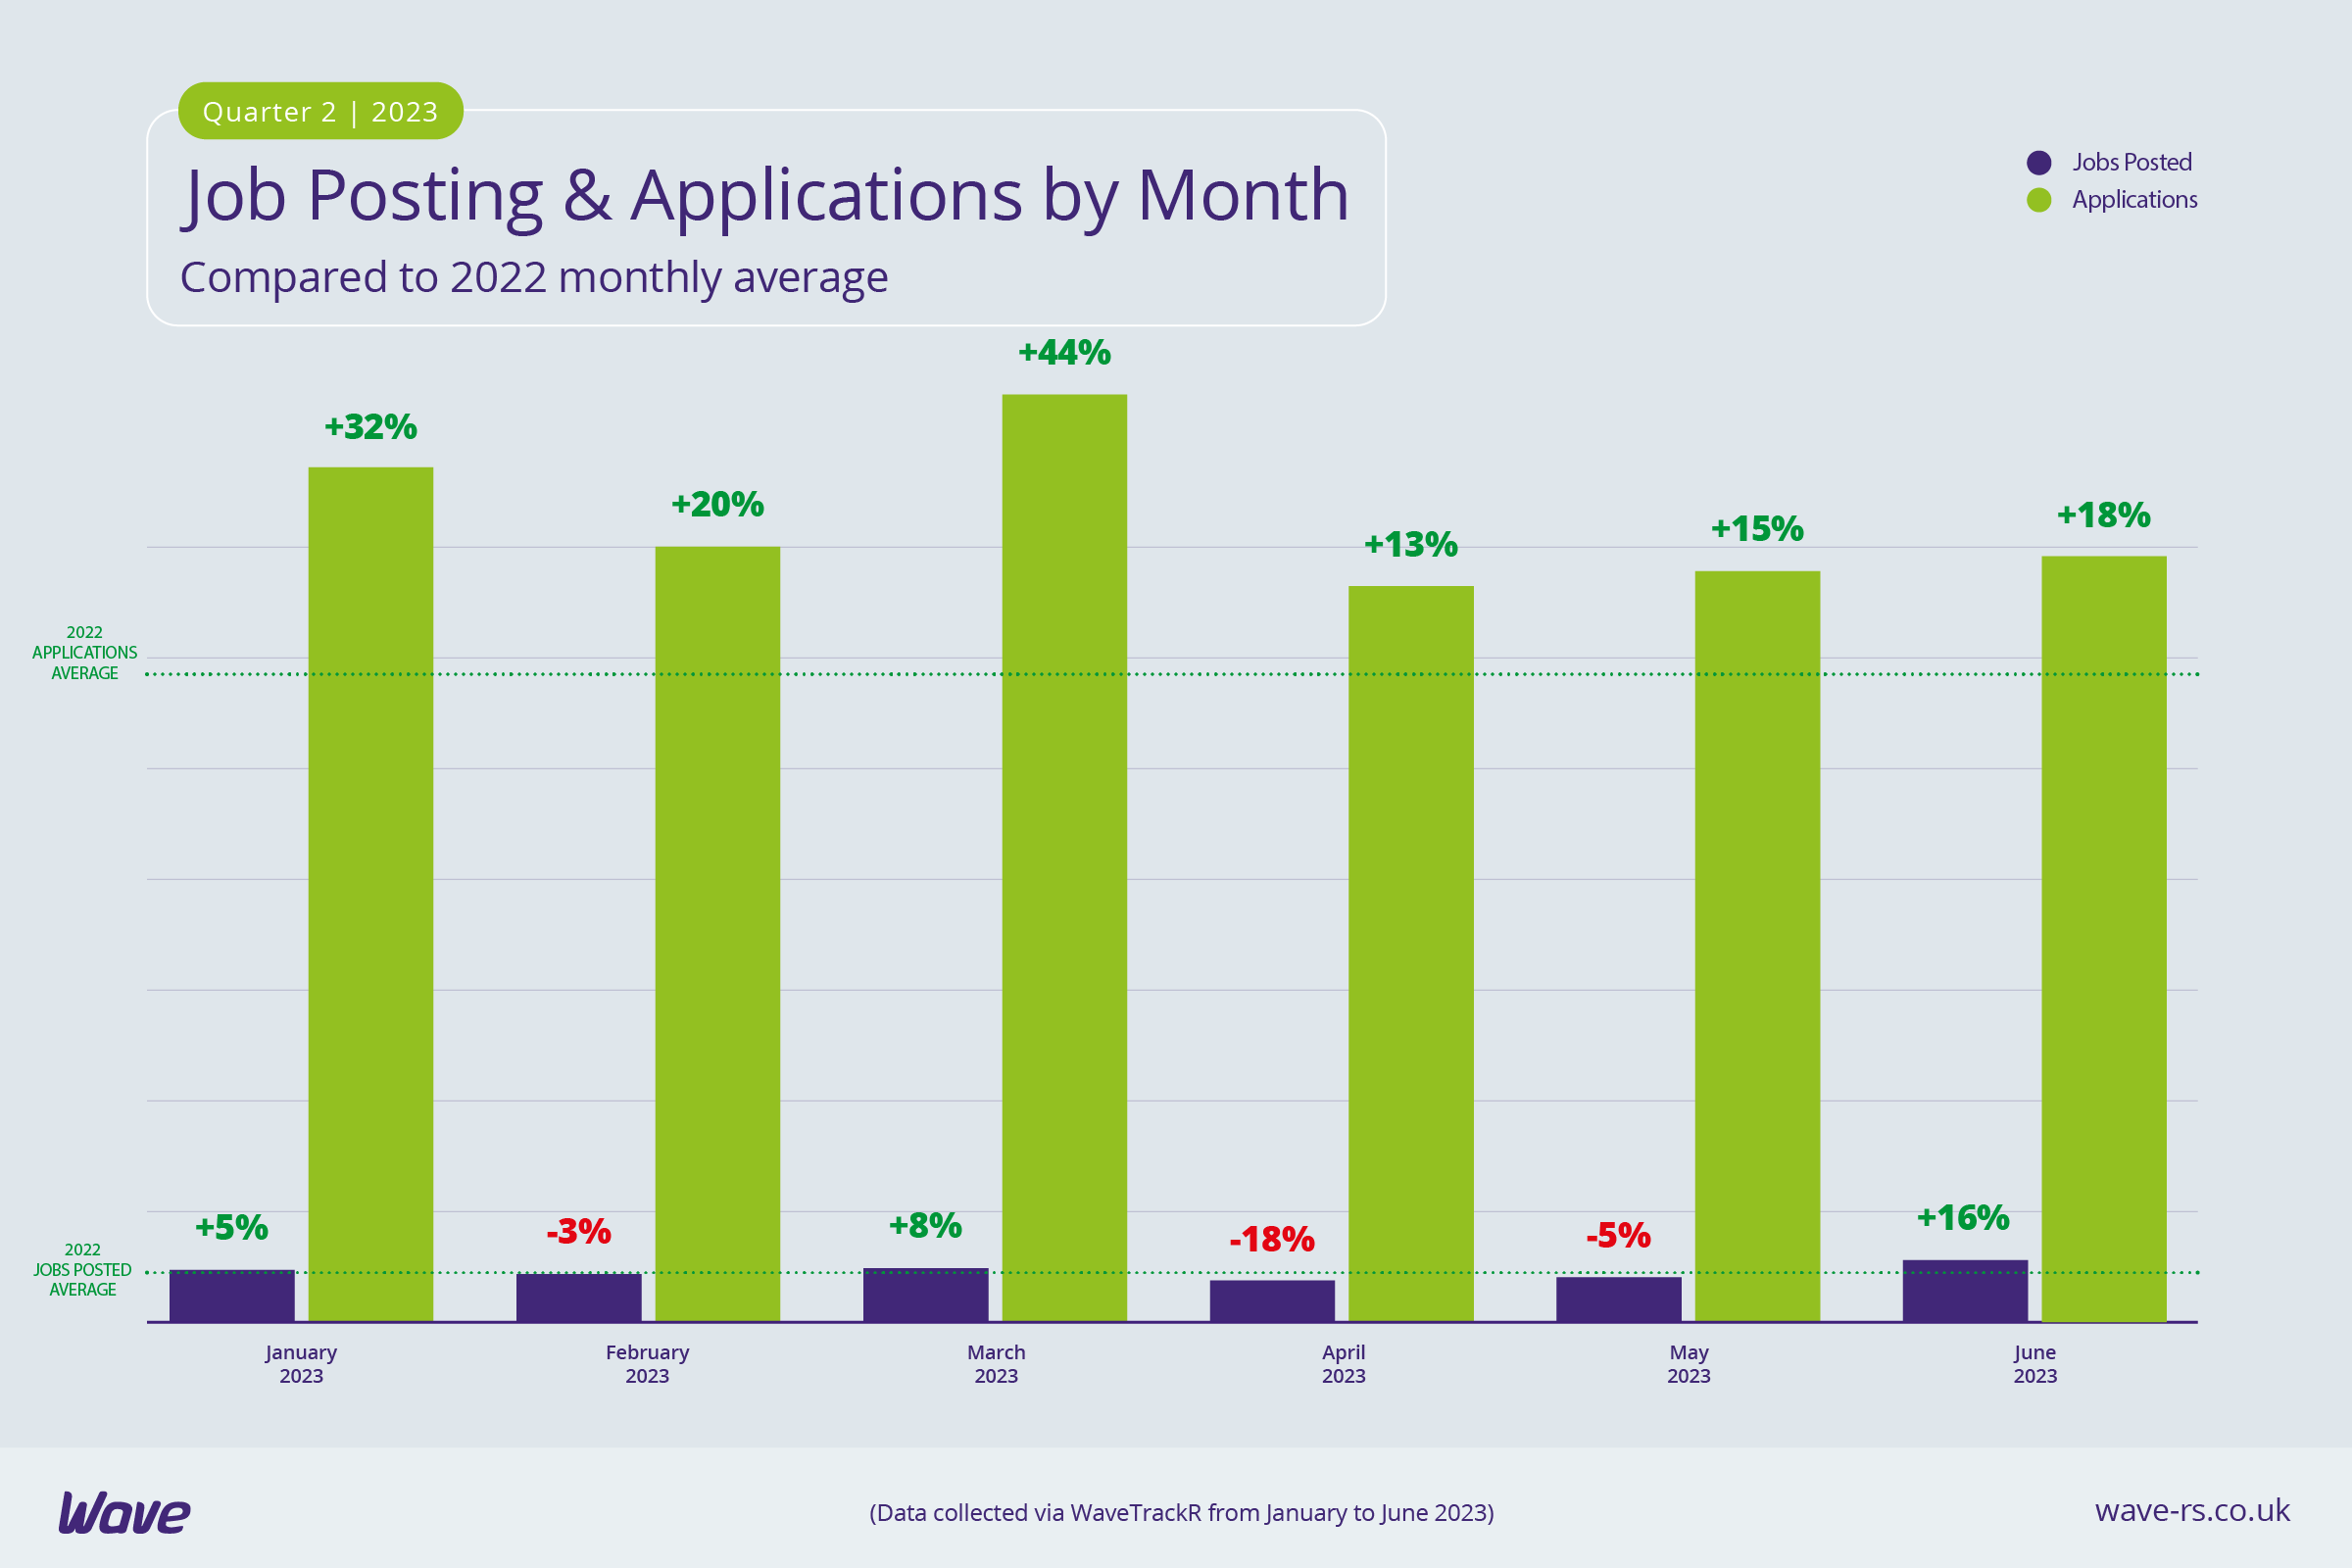
Job activity ramps up in June
Recruitment activity in Q2 as a whole may have decreased from Q2 but figures pick up significantly in June. Both jobs and applications in June are up on May - the first time jobs have risen since March. At 16% higher than the 2022 monthly average, jobs were the highest they’ve been all year. Applications were 18% above the 2022 monthly average, which is the highest they reached in Q2 but lower than in any month in Q1. Following two months of holidays, celebrations and office closures, recruiter and candidate activity begins to ramp up again in June.
IT & Internet posts highest jobs in Q2
Perennially job-heavy IT & Internet posted the highest percentage of jobs in Q2 (19%), which is unchanged from Q1, although the percentage share did drop from Q1 to Q2. The industry didn’t receive the highest number of applications but weren’t far off the top spot, receiving a healthy percentage of applications. This is a great indication that supply and demand for IT & Internet jobs is well balanced.
Secretarial, PAs & Administration net highest applications in Q2
The industry receiving the highest percentage of applications in Q2 has changed from Q1, with Secretarial, PAs & Administration taking a 17% share and knocking IT & Internet from the top spot. However, the industry doesn’t appear in the top 5 for jobs, suggesting a shortage of jobs compared with candidate demand - an issue shared by Engineering & Utilities.
Health & Nursing’s historic but very present skills shortage
Health & Nursing were only just behind IT & Internet’s jobs figures, with a 17% share. However, the industry doesn’t even make it into the top 5 for applications and received an average of just 6 applications per job in Q2, 12 below the overall average, highlighting its historic but still very present skills shortage. Education received an average of just 7 applications per job, perhaps because, like Health & Nursing, Education is an industry struggling to recruit and facing regular strikes from workers unhappy with pay and funding.
Applications and job posting dates disparity could mean fewer applications
Most jobs were posted on a Wednesday in Q1 and Q2 but the majority of applications were received on a Tuesday in both quarters - a gap of an entire week in between jobs being posted and applications being sent in, which is highly likely to affect the number of candidates who even see many of the jobs being posted. Data from the Wave Recruitment Trends Report for 2023 shows that the majority of applications are sent soon after a job is posted. For weekly listings, most applications were received within 24 hours of the job being posted, with applications dropping off with each passing day. For monthly listings, most applications were received within 48 hours, again diminishing as time passed.
In order to ensure your job has been freshly posted when candidates are actively searching, it’s vital to post at the right time. As job boards prioritise newer jobs
in organic searches, you need to post your jobs on the day that the majority of candidates apply. By posting the day after (or, looked at another way, a week before) the day most candidates are searching and applying for jobs, your job will be further down the search results of the job boards. This could mean the difference between your job appearing on page 1 or page 21 when qualified candidates are looking.
Banking receives soaring average application per job numbers
Banking received an average of 73 applications per job in Q2. Compared to the overall average of 18, that figure is quite astounding and is possibly reflective of the security many feel that a job in Banking offers. In turbulent times, job security is often a key candidate motivator. Secretarial, PAs & Admin received an average of 40 applications per job (the second highest figure) which, given the industry received the highest percentage of applications but didn’t post a similarly high number of jobs, is perhaps unsurprising.
Want more applications? Consider going niche
Niche job boards continue to offer the highest average number of applications per job - each of the three job boards receiving the highest average in Q2 were niche. IT-focused Jobserve came out on top with an average of 37 applications per job, Secretarial, PAs & Admin-focused Secs in the City were second with an average of 33, and Catering-focused Caterer.com received an average of 28 applications per job. Totaljobs was just behind with 26 but Reed.co.uk and CV-Library received around a third or less of the niche boards with 11 and 10 applications per job respectively.
Q2 was a quieter time for recruiters compared to Q1 but the upwards trajectory in June is proof that activity is not stalling. With summer and school holidays affecting recruiter and candidate numbers, Q3 may be another quiet quarter. The trend is usually a dip in applications and jobs over the summer months, with activity rising in September and October as children go back to school, graduates look to enter the workforce, and post-holiday reflection causes people to reassess their jobs and consider moving. As always though, the proof is in the data, so watch this space!