

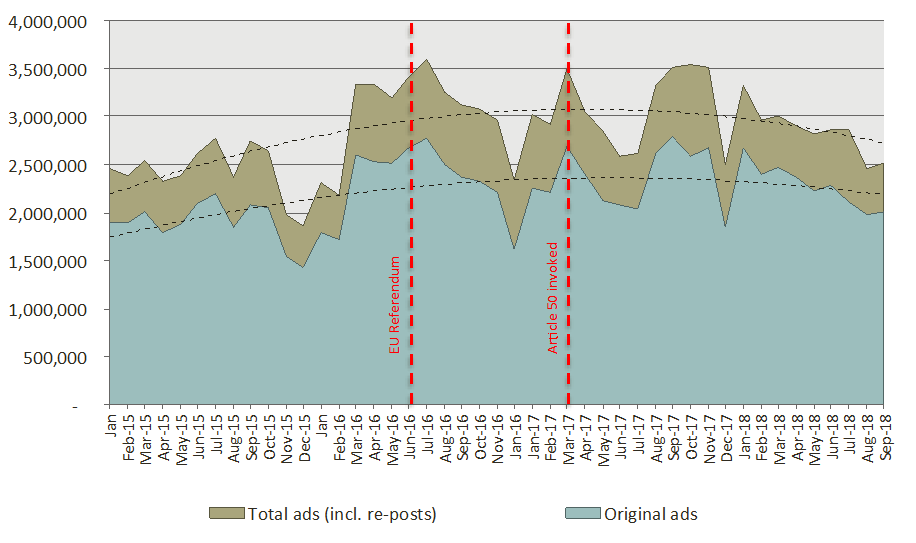
At c.2.00m in September 2018, the number of original job ads captured by Innovantage was 28% lower than in the same month last year and 15% lower than in September 2016.
- In addition, 0.52m reposts of previous adverts were captured - suggesting that the role was unfilled via the original post and/or it was a role that an employer continually advertises. This equated to 25% of the volume of original ads posted.
- At 2.51m, the combined total of original job ads and reposts 29% lower than in September 2017, and 19% lower than in September 2016.
The number of original job ads, and the total (including reposts), Jan 15 – Sept 18
Set into context of the most recent total number of UK workforce jobs (35.2m in June 2018), the workforce jobs total was just 0.4% (133k) higher than a year earlier and 1.7% (584k) higher than in June 2016 and of the official ONS vacancy number for the quarter ending September 2018 (832k), UK vacancy numbers were 4% higher than the figure one year earlier and 11% higher than in July-September 2016.
For each official vacancy, employers and their intermediaries posted 2.4 original jobs ads in Sept 2018 (a ratio of 2.4 to 1):
- This was notably lower than the ratio of 3.3 to 1 a year earlier.
The ratio of total ads (including reposts) to official vacancies was 3.0 to 1 in September 2018:
- This was, again, significantly down from 4.4 to 1 in September 2017.
Engagement status: 28% of original ads, where the engagement status was specified, were for contingent opportunities
- There were 1,028k ads (51%) specifying a permanent opportunity in September 2018:
o This was 18% lower than the figure recorded in September 2017, when perm equated to 45% of all original ads.
o 72% of all original ads, where the engagement status was specified, were for permanent opportunities.
- There were 390k ads (19%) specifying a contract or temporary opportunity in September 2018:
o 17% lower than the figure recorded in September 2017, when 17% of ads specified a contingent opportunity.
o 13% fall in the number of ads highlighting that work was temporary, whilst there was a 20% fall in contract opportunities.
o 28% of all original ads, where the engagement status was specified, were for contingent opportunities.
- 28% of original ads in September 2018 did not carry any detail of engagement status:
o This was down from 37% in September 2017.
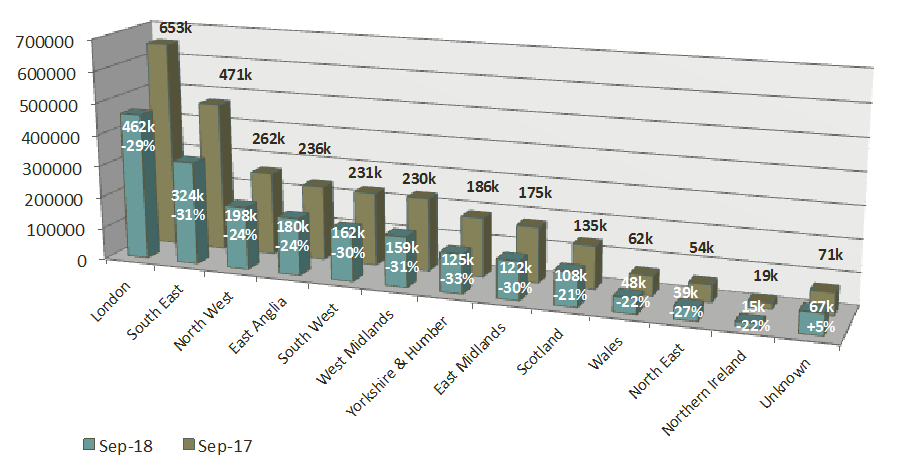
Regional profile: above average fall in the number of original ads in the South East and Yorks & Humber
Beneath the 28% YoY decrease in the volume of all original online job ads across the UK, the regional variations were noteworthy. Amongst regions where the YoY decrease was higher than the UK average:
- In the South East, original ad numbers were 31% lower than in September 2017.
o This was in despite of the fact that latest available workforce jobs profile (June 2018) show that the volume of jobs in the South East was just 2% lower than in June 2017.
- In Yorkshire & Humber, the volume of original ads was 33% lower than in September 2017.
o Again, this was in despite of the fact that latest available workforce jobs volume of jobs in the region was 2% higher YoY.
In no region did the number of original job ads increase YoY.
All original job ads, by region, Sept 2017 and Sept 2018
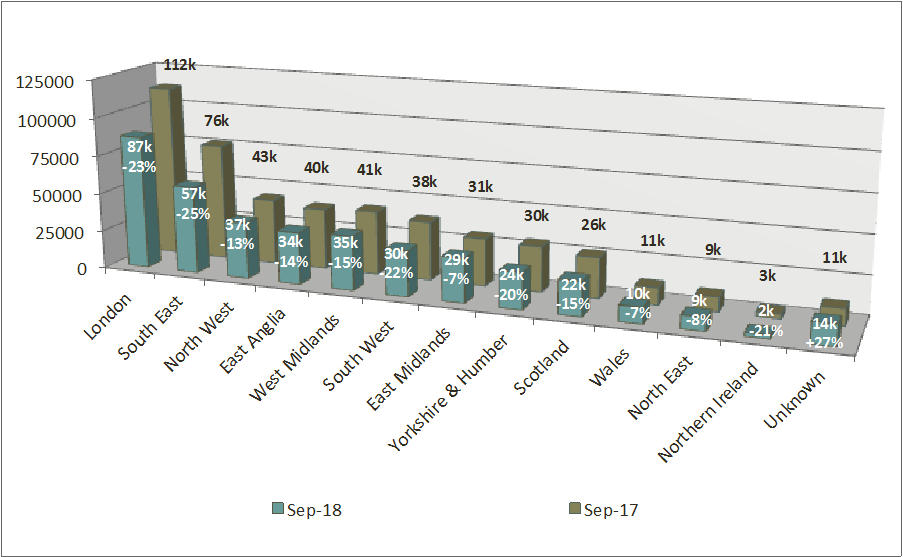
Beyond the 17% overall annual decrease in the number of original temporary/contract ads posted in September 2018, the YoY change in the proportion of contingent ads by region should be set into context of an increase in the volume of ads carrying no locational detail. This month, however, the YoY differential was only marginal.
- The proportion of perm ads where no location was specified (3.2%) was higher than the level in September 2017 (2.2%).
- The proportion of contingent ads where no location was specified (3.5%) was higher than the level recorded in September 2017 (2.3%).
Notably above-average decreases were experienced in a handful of regions including London (-23%), the South East (-25%) and the South West (-22%) whilst - in contrast - the fall was less severe in the North West (-13%), the North East (-8%), Wales (-7%) and the East Midland (-7%).
Original job ads specifying temporary or contract work, by region, Sept 2017 & Sept 2018
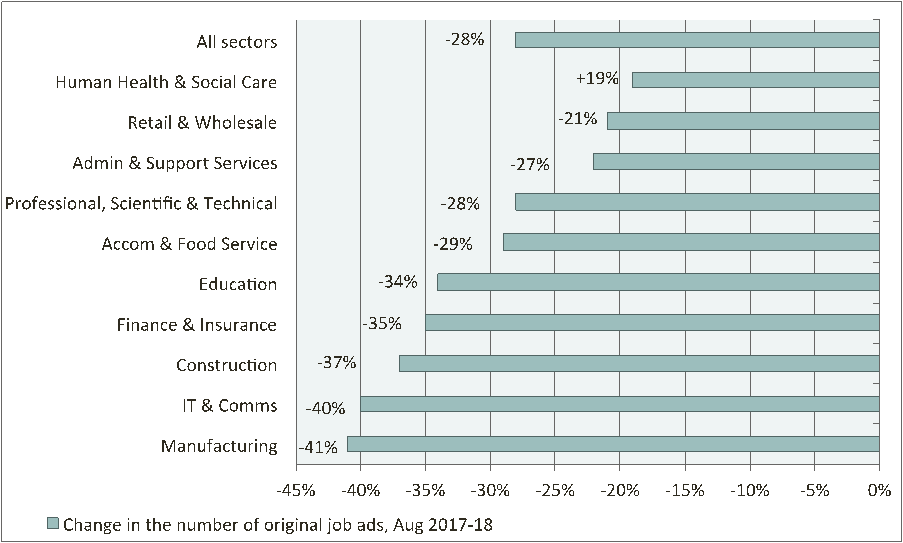
Industry profile: downturn in demand, YoY, in all sectors
Percentage change in the number of original job ads, by sector, Sept 2017-18
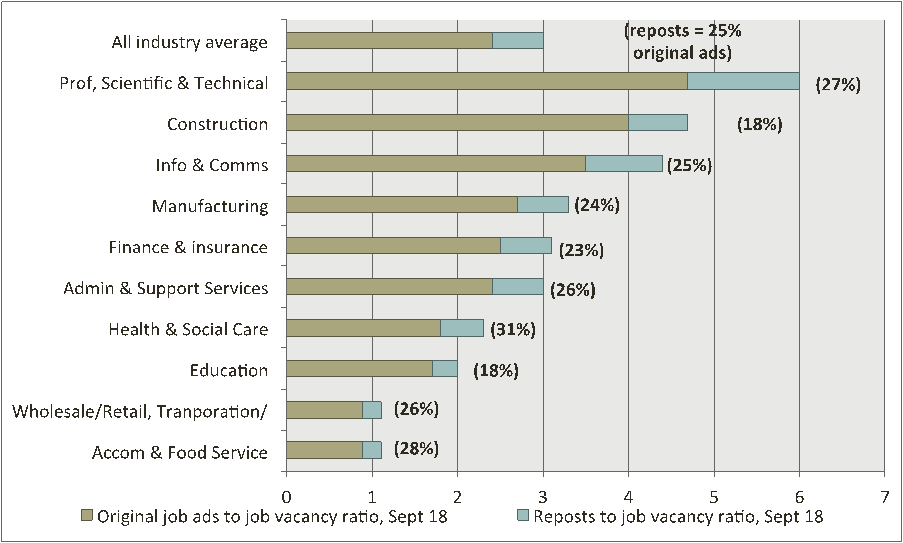
Combined ratio of original job ads & reposts to ONS vacancy numbers (+ reposts as a percentage of original posts), Sept 2018
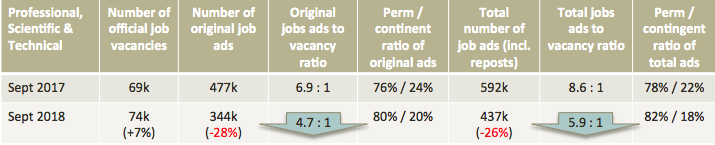
Professional, scientific & technical
Whilst there was a 7% year-on-year (YoY) increase in official vacancies within the Professional, Scientific & Technical industries, between July-Sept 2018, there were 28% fewer original job ads were posted in September. That said, employers and their intermediaries in these industries still placed 4.7 original ads per vacancy in an attempt to fill the posts – significantly higher than the 2.4 to 1 all-occupation average. The noteworthy exception to this month’s significant downward trend in ad numbers was the legal profession, where just 7% fewer ads were posted than in September 2017. There was also a 4-percentage point increase, YoY, in the proportion of ads offering permanent over contingent opportunities.
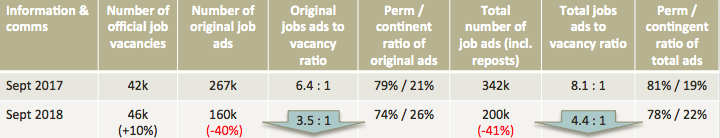
Information & communications
Despite a 10% annual increase in the number of official vacancies in the three months to September, the number of original job ads in the final month of the period was 40% lower than the number posted a year earlier. As with the previous category, however, at 3.5 original ads to 1 official vacancy, the ratio was notably higher than the 2.4 all-occupation average. Also of note, there was also an upward shift, YoY, in the proportion of ads advertised on a contingent rather than permanent basis.
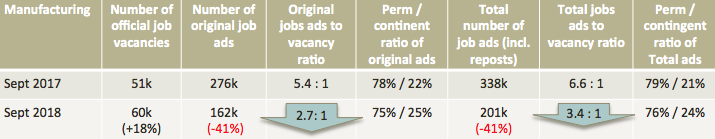
Manufacturing
Manufacturing was another category where, despite an 18% rise in official vacancies, there was a significant decline, YoY, in the number of ads posted - falling by 41%. This included a 53% fall in the number of original ads for design engineers.
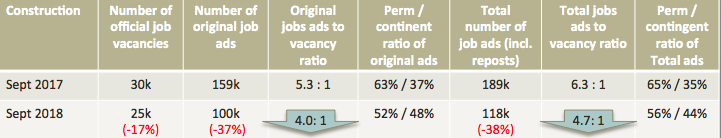
Construction
Within the Construction sector, the 17% fall in official vacancy translated into a 37% fall in the number of original job ads. This included a 52% fall in the number of ads for surveyors and a 51% fall in ads for civil engineers. There was also a significant downward significant shift in the proportion of opportunities advertised on a permanent basis – from 63% to 52% YoY.
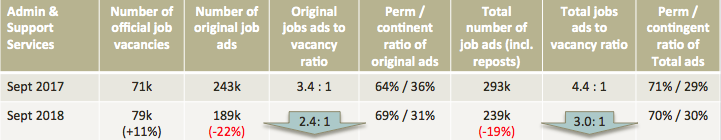
Admin & Support Services
Despite an 11% increase in admin & support service job ads between July-Sept 2017-18, the number of original job ads fell by 22% YoY. There was also an increase in the proportion of ads offering permanent, rather than contingent work.
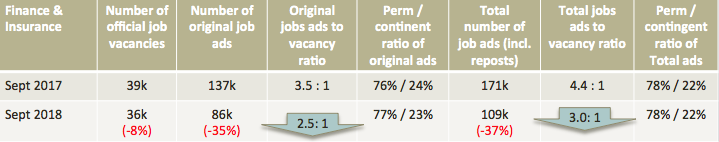
Finance & Insurance
An 8% fall, YoY, in the number of official finance & insurance vacancies posted (n July-September) translated into a 35% fall in original ads in the last month of the quarter (September). This included a 48% fall in the number of ads for financial advisors and a 43% fall in the posts for mortgage advisors.
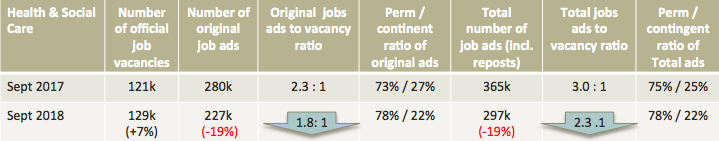
Health & Social Care
Whilst there was a 7% increase, YoY, in the number of official job vacancies within health & social care, the number of official job ads declined by 19%. This included a 39% fall in the number of original ads for social workers and 32% fewer ads for dental practitioners. Conversely, there were 4% more ads for pharmacists. Of additional note, the proportion of original ads offering permanent work increased YoY from 73% to 78%
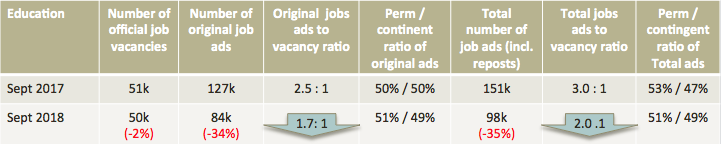
Education
Whilst the number of official vacancies in the education sector fell by just 2%, YoY, the number of original job ads posted on-line in September was 34% lower than a year earlier. This included 41% fewer ads for lecturers and 48% fewer original posts seeking to attract supply teachers.
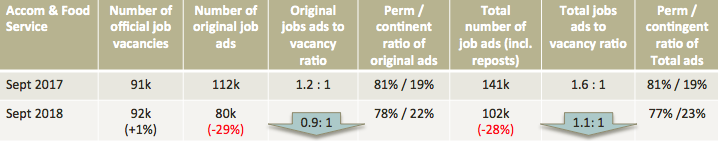
Accommodation and Food Service
Despite official vacancy number within the accommodation & food service sector being 1% higher, in July-September 2018, than in the same period last year, original job ads were 29% lower in the last month of the period (September). This included 35% fewer ads for chefs, 19% fewer ads for both Waiting/Bar staff and a 3% decline in ads for Baristas.
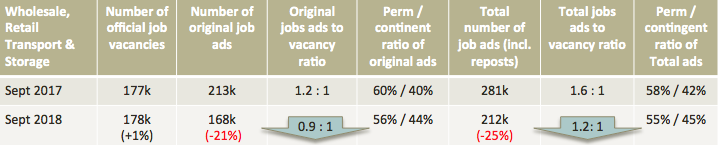
Wholesale, Retail, Transport & Storage
Despite a 1% increase in the number of official vacancies in July-September 2018, the number of original ads fell by 21% in September. Within retail, there was a notable decline in the number of ads for merchandisers (down 49%). Similarly, there was a 28% decline in the number of ads for procurement professionals, YoY. There was also a 4 percentage point shift, YoY, towards contingent rather than permanent work opportunities presented within original ads.